
Google AdsCertified
✓ Analytics for Shopping Malls
Analytics for Shopping Malls in Singapore
A mall cannot see who walks through the doors the way an online shop sees a basket. Analytics fills the gap with the signals that can be measured: directions taps, event interest, offer redemptions, gift card sales and leasing requests, each tied to the campaign that prompted it.
For shopping malls that want campaign results shown through directions, offers, events and leasing requests, with honest limits on counting visits.
What counts as a result for a shopping mall
Context from how your customers search, compare and book.
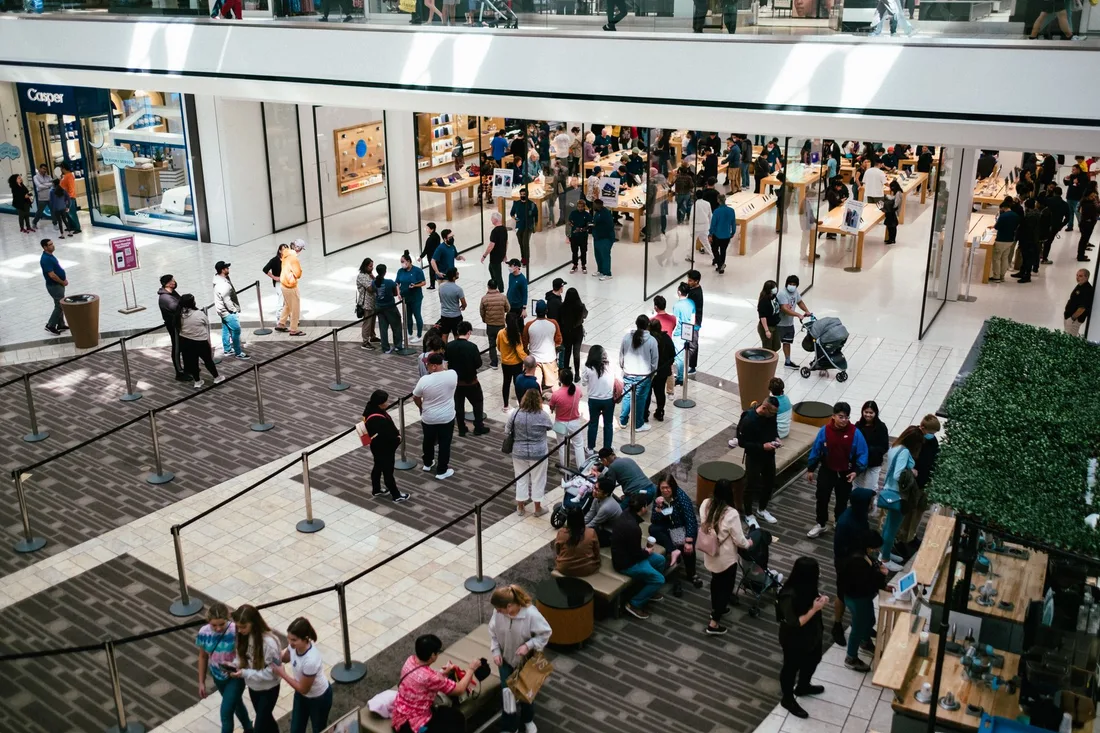
The ultimate result is a visit, and visits are hard to trace. A mall has door counters, parking records and tenant sales, but a search or ad rarely connects to any of them directly. Analytics therefore leans on signals that sit between interest and arrival, and treats door counts as a check, not as proof.
Useful signals exist. Taps on directions, calls to the information desk, views of the store directory and parking pages, event registrations, gift card sales and redeemed offer codes all show intent. A shopper who searches for a store and then taps directions is close to arriving, and each such signal can be tied to its source.
A mall has two audiences. Shoppers want hours, stores, dining and events, while tenants and brands considering a unit want space, location and leasing contacts. Reports must keep them apart, because a campaign that fills the parking areas on Saturday says nothing about the quality of leasing requests that month.
Everything is seasonal. Back-to-school weeks, holiday trading, sale periods and school breaks each reshape visits regardless of marketing. We chart results beside the retail calendar, show last year's same weeks where available and label what is estimate, so a good week is not wrongly credited to a campaign.
Who this tracking is for
groups Customer segments
- person Regional malls competing with outlets and online shopping
- person Malls launching a food hall, cinema or entertainment anchor
- person Marketing teams that run seasonal and event campaigns
- person Leasing managers who need to fill vacant units and pop-up spaces
psychology What drives their decision
- check_circle Directions, offers and events counted by source
- check_circle Shopper results kept apart from leasing results
- check_circle Door counts and parking shown beside campaigns
- check_circle Tenant-friendly summaries of store page interest
How we deliver Analytics
A clear, repeatable process built around how shopping malls customers search and decide.

1
Agree the signals
With your team we list what counts: directions taps, information desk calls, store page and directory views, event sign-ups, gift card sales, offer code redemptions and leasing requests. Each signal gets a clear definition and an owner who can verify it.

2
Tag the site, listing and offers
Events are placed on directions buttons, store pages, event pages and forms. Calls from the map listing and site are tracked by source. Offer codes and vouchers are given unique labels per campaign, so a redemption points back to what drove it.

3
Bring in door and parking data
We compare campaign periods with door counter and parking figures, if you have them, using the same weeks in the previous year as a baseline. The report shows whether visits rose and says plainly that a rise cannot be put down to one campaign.

4
Separate leasing from shopper results
Leasing requests, with unit size, category and timing, are tagged by source and followed to viewing and deal where your team records them. Shopper and tenant reports are delivered apart so that neither distorts the other.

5
Report and adjust
Each month you receive a short report: signals by source, offer redemptions, event interest, leasing leads, store pages most viewed and what we suggest changing. We flag figures that rest on few cases and avoid claiming impact we cannot show.
monitoring
What Shopping Malls Analytics includes
See which channels bring real enquiries and new customers in Singapore
- check_circle Signal list and tracking setup
- check_circle Source and offer-code tracking
- check_circle Monthly mall report
- check_circle Leasing request report
- check_circle Spend review in plain words

What you can expect
- verified You know which search, ad or event page led to directions and sign-ups
- verified Offer redemptions point back to the campaign behind them
- verified Shopper and leasing results are never mixed
- verified Door and parking figures sit beside campaign weeks
- verified Tenants receive a simple summary of store page interest
- verified Seasonal peaks are separated from campaign effects
Deliverables you receive
inventory_2 A list of mall signals: directions, calls, directory views, events, gift cards, offers and leasing
inventory_2 Tracking on directions buttons, store and event pages and forms, tested on mobile
inventory_2 Unique offer codes and labels for each campaign
inventory_2 A comparison of campaign weeks with door and parking figures
inventory_2 A separate leasing request report by unit size, category and source
inventory_2 A monthly report in plain language with store-page interest for tenants
Technical approach
The mechanics behind Analytics for shopping malls, explained plainly.
Offer and voucher codes
Each campaign carries its own code or voucher label, and tenants who accept it report redemptions by code. This gives the nearest thing to a direct link between an ad and a purchase, and we show it separately from softer signals such as directions.
Directory and store pages
Store pages are marked so you can see which tenants draw interest by source and season. We can share a short summary with each tenant, which helps when they ask what the mall's marketing does for them, without exposing other tenants' figures.
Door counters and limits
Door counters measure everyone, including staff and passers-through. We use them as context, compare like weeks and say plainly that they cannot be tied to an ad. Mobile movement data, where used, is aggregated and consented, never individual.
Marketing from $500 USD a month
Month to month, no commitment. One fee covers the pages, the search and ad work and the tracking. Ad spend is separate and stays in your own accounts.
Starting at
$500 USD per month
Free to cancel with 1 month's notice. Tell us what you sell and where. We come back with what the first month would fix.
Get a Free AuditWhat $500 a month covers
Measurement stack review
IncludedAnalytics, tag manager, ad pixels and call tracking are inspected together to see which tools disagree and why.
Written tracking plan
IncludedBusiness goals translate into a documented list of actions worth measuring, with owners and naming conventions agreed.
Consent-aware collection
IncludedCookie banner choices are honoured across tools, helping keep data gathering in line with privacy rules.
Ad platform conversions
IncludedConversions pass into ad accounts and get checked until platform figures sit close to real results.
What to expect from analytics
The first weeks put tracking in place. A full retail season gives the useful comparison.
Days 1 to 14
Signals are agreed and installed on the site, map listing and offers, with test taps and test calls on mobile. We also set up the leasing request report and label which directories and partners send leads.
Weeks 3 to 8
The first report shows directions, calls, event sign-ups and leasing leads by source, beside door counts if available. You see which stores and events draw interest. We suggest first changes and agree unique offer codes for the next campaign.
Months 3 to 6 and beyond
Over a season, repeated campaigns and last year's weeks give fairer comparisons. Tenant summaries are shared and leasing leads can be followed to a deal. We never promise visit numbers, and small samples are labelled.
Other Shopping Malls marketing services
search SEO for Shopping Malls in Singapore arrow_forward query_stats SEM for Shopping Malls in Singapore arrow_forward ads_click Meta Ads for Shopping Malls in Singapore arrow_forward web Web Design for Shopping Malls in Singapore arrow_forward handshake CRM Integration for Shopping Malls in Singapore arrow_forward psychology AI Optimisation for Shopping Malls in Singapore arrow_forward
Our team
The same people on the audit and on the work
Elmer owns your measurement stack, from the written tracking plan and consent-aware collection to ad platform conversions, so reporting rests on revenue-quality data.
-

Martin
Founder, strategy and audits
Writes every audit and takes every first call. On your account from day one, running growth for SMEs since 2010.
-

Yoana
Social and app development
Shapes social strategy and builds practical app experiences that turn attention into action.
-
 Leads this work
Elmer
Analytics
Connects tracking, attribution and reporting so decisions are based on revenue-quality data.
-

Mike
SEO
Owns technical, local and content SEO so the right buyers find you when demand is highest.
-

Robert
Paid media
Plans and manages paid search and social campaigns around qualified leads.
-

Dino
Design
Creates clear brand and conversion-focused design across landing pages, campaigns and product experiences.
Certified and experienced
Certified where it matters. Accountable for the outcome.
Verified platform knowledge, 25+ years of hands-on experience, and an operating track record since 2010.
Google AnalyticsCertified
✓Google Tag ManagerCertified
✓Operating since 2010Proven experience
✓Frequently Asked Questions
Can you measure visits to a mall from an ad? expand_more
Not exactly. Shopping malls have door counters but no direct link from ad to arrival. We use directions taps, calls, events and offer codes as nearer signals, and treat door counts as context.
What is the best way to link a campaign to a purchase? expand_more
For shopping malls, a unique offer code or voucher label per campaign, redeemed at tenant checkouts and reported back. It is the closest to proof, though it covers only participating tenants and customers who use the code.
How do you handle tenants asking for results? expand_more
Tenants in shopping malls often ask what marketing does for them. We can prepare a short summary of store page views, directions taps and event interest for each tenant. It uses only that tenant's data and avoids comparisons that would cause friction.
Do you track leasing separately? expand_more
Yes. Leasing requests for malls are tagged by unit size, category and source and followed to viewing and deal where your team records them. Shopping and leasing results are reported in separate sections.
Can door counters be used? expand_more
As context, yes, though door counts in malls include staff and passers-through. We compare campaign weeks with the same weeks last year and show the difference, but a rise cannot be put down to one source, and we say so in the report.
What about location data from phones? expand_more
Where you already use it, we treat it as aggregated and consented, and use it only as a rough check. We do not buy or build individual movement profiles for shopping malls.
How soon is the report useful? expand_more
A first view arrives within weeks, but shopping seasons are long, so a fair comparison needs a few months or a full trading peak. We flag any figure that rests on too few cases.
Ready to get more from Shopping Malls Analytics?
Get a free audit and we will show you where you are losing enquiries today.
Get a Free Audit arrow_forward
Reviewed by
Martin Marinov
Founder, HeyLead
Martin founded HeyLead and has worked in SEO and paid search for more than 20 years, across Google Ads, Microsoft Ads and organic search.