Google AdsCertified
✓SEM / Paid Search
Transparent Reporting Dashboards
ROI-Focused Metrics You Can Act On.
Weekly reports that connect what you spend on ads to qualified leads and revenue, not just clicks, views, and numbers that look good but mean little.
A live dashboard plus a written summary from a person, so you always know what is working, what changed, and what we suggest next.
Get a Free Reporting Audit arrow_forwardWeekly
Performance Reports
100%
Spend Visibility
3.1x
Faster Decisions
CRM
Pipeline Tie-In
Why Most PPC Reports Fail Decision-Makers
Common Issues We Fix
- Screenshots of Google Ads with no explanation or advice
- Clicks and views reported instead of qualified leads
- No link between ad spend and the deals in your CRM
- Monthly reports too late to catch problems early
- Different metrics across Google, Bing, and analytics
Our Philosophy
A report should answer four questions: what did we spend, what did we get, were the leads any good, and what happens next? We build dashboards around business results and add a short written summary, so you can make quick budget decisions.
How We Build Reporting - The Details
Dashboard Architecture
- Looker Studio / Custom Dashboards: One view that brings together Google, Bing, Google Analytics, and your CRM.
- Core KPIs: What you spent, how often ads were seen and clicked, how many leads or sales came in, cost per lead, return on ad spend, and the share of leads that were qualified.
- Segmented Views: By campaign, by how ready people are to buy, by location, by device, and by time period.
- Automated Data Refresh: Numbers are pulled in from your ad accounts and CRM every day, so they stay current.
Analysis & Recommendations
- Weekly Narrative: What changed, why, and what we did about it, in plain language.
- Search Term Highlights: The best new searches and the wasteful ones from the week.
- Budget Movement Log: Transparent record of reallocation decisions.
- Monthly Strategic Review: Trends, testing results, and forward plan.
Our Reporting Setup Process
01
KPI Definition Workshop
We agree on what a qualified lead means and which numbers matter most to you.
02
Data Source Integration
Connect ad platforms, GA4, and CRM into unified reporting.
03
Dashboard Build
We design one view for owners and executives, and one for the people running the ads.
04
Baseline & Benchmarks
We record your starting cost per lead, return on ad spend, and lead quality, so progress can be measured.
05
Weekly Cadence Launch
Reports delivered with narrative and action items.
06
Iterate on Questions
Refine dashboard as your team asks better questions.
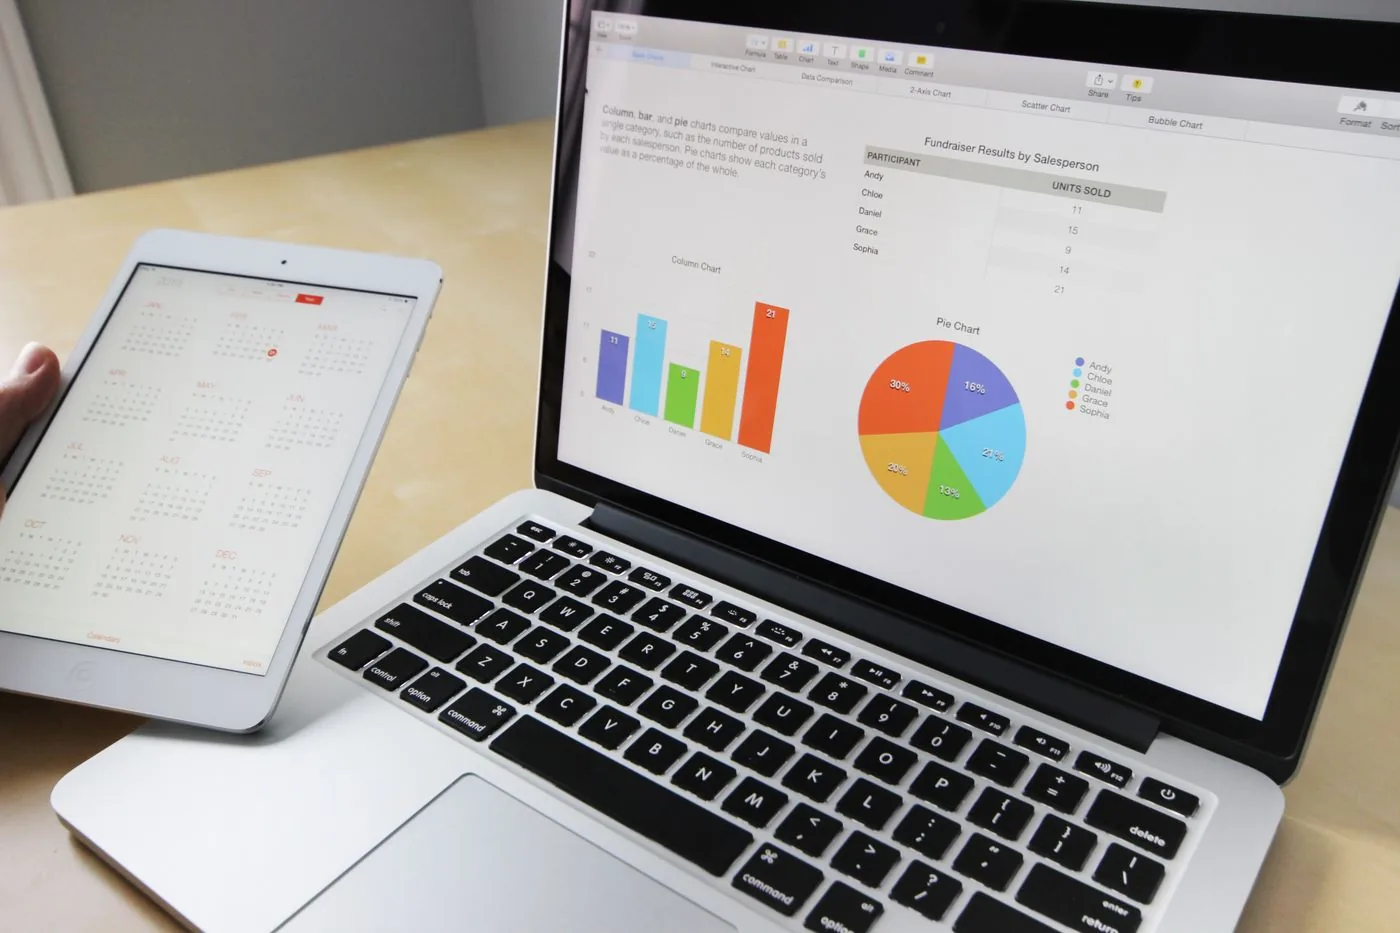
Reporting that shows booked jobs, not last-click vanity



FAQ
Common questions
What to know before you get started.
What metrics do you include in weekly reports?
What you spent, leads or sales, cost per lead, return on ad spend, how often your key campaigns showed, notable searches, budget changes, and the share of qualified leads once your CRM is connected.
Can you report on pipeline and revenue, not just form fills?
Yes, once your CRM is connected. We show what each qualified sales opportunity costs and how much revenue the ads helped bring in, not just form fills.
What tools do you use for dashboards?
Looker Studio primarily. Custom setups for clients needing Data Studio alternatives or internal BI tools.
How is this different from Google Ads built-in reporting?
We bring Google, Bing, and your CRM into one report. We add a written summary, advice, and measures Google does not show, such as lead quality.
How often do we get reports?
Weekly performance summaries standard. Monthly strategic reviews. Ad-hoc alerts for tracking breaks or CPA spikes.
Can we access live dashboards anytime?
Yes. Dashboards refresh daily so you are never waiting for a PDF to see yesterday's spend.
Do you report on competitor impression share?
Yes on priority campaigns. Auction insights included in monthly reviews.
How do you report Bing and Google together?
The same cost per lead and return on ad spend measures for both platforms, so you can compare them fairly.
What if we need board-ready summaries?
One-page summaries with trend charts, key wins, and budget advice, written without jargon.
Can you integrate with our existing BI stack?
Yes. We can send the data to BigQuery, Snowflake, or your own data warehouse for internal reporting.
How do you attribute leads to campaigns in reports?
We match Google's click ID, campaign tags (UTMs), and the source field in your CRM to campaign names. The method is written down.
What happens when numbers disagree between platforms?
We find the reason and write it down, for example different time windows for crediting a sale, double counting, or tagging problems. We agree up front which source of numbers is the one to trust.
Do you include SEO and paid together?
Optional cross-channel view when you use multiple HeyLead services. Paid reports stay focused on paid KPIs by default.
Can we customize what the dashboard shows?
Yes. KPI workshop upfront defines your views. We iterate based on feedback.
How do we get started?
Request a free reporting audit. We review your current reports and where their data comes from, then propose a dashboard for you.
Ready for reporting that actually explains your ROI?
Get My Free Reporting Audit arrow_forwardMarketing from $500 USD a month
Month to month, no commitment. One fee covers the pages, the search and ad work and the tracking. Ad spend is separate and stays in your own accounts.
Starting at
$500 USD per month
Free to cancel with 1 month's notice. Tell us what you sell and where. We come back with what the first month would fix.
Get a Free AuditWhat $500 a month covers
PPC KPI shortlist
IncludedA handful of search advertising numbers such as cost per lead and impression share are agreed ahead of any build.
Search ads data feeds
IncludedGoogle Ads and Microsoft Advertising data are pulled into one location for consistent numbers.
Query and device breakdowns
IncludedViews split results by query, device, location and hour to show where clicks turn into enquiries.
Starting benchmarks
IncludedOpening account figures are logged so later updates measure change against that baseline.
Our team
The same people on the audit and on the work
PPC reporting from Elmer starts with a short KPI list and starting benchmarks, then feeds search ads data into query and device breakdowns Robert acts on.
-

Martin
Founder, strategy and audits
Writes every audit and takes every first call. On your account from day one, running growth for SMEs since 2010.
-

Yoana
Social and app development
Shapes social strategy and builds practical app experiences that turn attention into action.
-
 Leads this work
Elmer
Analytics
Connects tracking, attribution and reporting so decisions are based on revenue-quality data.
-
 Leads this work
Robert
Paid media
Plans and manages paid search and social campaigns around qualified leads.
-

Mike
SEO
Owns technical, local and content SEO so the right buyers find you when demand is highest.
-

Dino
Design
Creates clear brand and conversion-focused design across landing pages, campaigns and product experiences.
Certified and experienced
Certified where it matters. Accountable for the outcome.
Verified platform knowledge, 25+ years of hands-on experience, and an operating track record since 2010.
Google AnalyticsCertified
✓Google Tag ManagerCertified
✓Operating since 2010Proven experience
✓